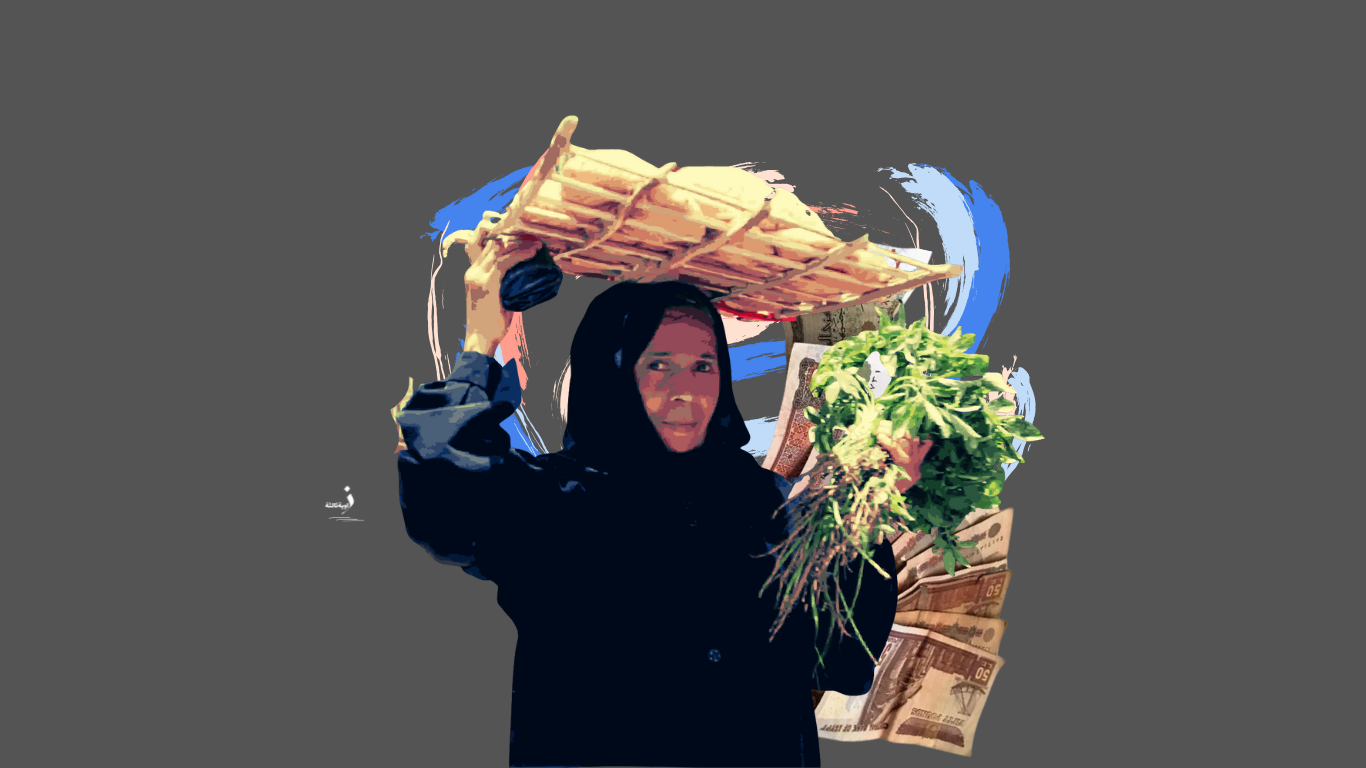


Early in the morning, Ahmed Harb, 32, waits with fellow delivery workers outside a well-known fava-bean and falafel restaurant in Bab El-Khalq. Sitting on his motorbike, he waits for an order to take to a customer. Each delivery earns him EGP 10–20, never more: the fee depends on the distance, he says.
Harb has worked delivering food for more than four years. Asked what protections or benefits his employer provides, he smiles wryly. He bought the motorbike himself on instalments, he adds, while receiving only the delivery fee.
A short distance away, beyond Bab El-Khalq and along El-Qalaa Street through El-Helmiya El-Gedida towards Sultan Hassan Mosque, day labourers lean against the mosque’s wall. They wait for a vehicle to take them and their equipment to a new residential compound in El-Salam City.
Ahmed El-Hels, 45, says his and his colleagues’ daily pay is not fixed: it depends on the agreement and the work required. Labourers receive wages daily, weekly or sometimes for completing an entire job. Some tasks take only a few hours; others require ten continuous hours, for no more than EGP 500.
About half an hour’s walk away, Rabab Mohsen, 28, works for a service contractor on Metro Line 3. Her fixed shift lasts eight hours a day, helping passengers use the lift.
Rabab remains standing throughout those eight hours, although the task does not require it. A passenger asks why she does not bring a chair. “It’s forbidden,” she replies immediately. The woman embraces her, kisses her head and quietly leaves.
About 1.3 million young women and men enter Egypt’s labour market each year, while available opportunities amount to no more than half a million jobs. World Bank analysis suggests that full youth employment could increase GDP by 36%. The private sector generates approximately 75% of output and employs around 80% of workers, but structural obstacles constrain its potential.
Tourism led sectoral growth in 2024/25 at 17.3%, alongside arrivals of 17.4 million tourists, compared with around 15 million in 2023/24. Non-oil manufacturing grew 14.7%. The Arabic text gives ICT growth of 13.8%, a 180% increase in companies to 186, transport growth of 7%, electricity growth of 5.3% and construction growth of 4.1%. Its accompanying sector graphic instead places ICT at 14.4% and electricity at 5.2% for 2024/25; the discrepancy is disclosed in the table below. The text does not define the registration period or coverage behind the company count.
Growth by economic sector
| Sector | 2023/24 (%) | 2024/25 (%) |
|---|---|---|
| Tourism | 9.9 | 17.3 |
| Non-oil manufacturing | -5.2 | 14.7 |
| ICT | 13.8 | 14.4 |
| Banking | 4.5 | 12.2 |
| Transport and storage | 5.4 | 7 |
| Wholesale and retail trade | 6.1 | 3.7 |
| Construction | 5.7 | 4.1 |
| Social services | 5.6 | 4.7 |
| Electricity | 5.3 | 5.2 |
Official figures show unemployment falling to 6% in the first quarter of 2026, from 6.2% at the end of 2025, as the labour force reached approximately 35.4 million. About 2.13 million people were unemployed: 1.01 million men and 1.12 million women. Employment reached around 33.3 million, including about 23 million paid employees. Agriculture and fishing remained the largest employer, with 5.98 million workers, followed by wholesale and retail trade (5.69 million), manufacturing (4.87 million), construction (3.83 million) and transport and storage (2.89 million).
Employment in the five largest sectors, Q1 2026
| Sector | Share (%) | Men (million) | Women (million) | Total (million) |
|---|---|---|---|---|
| Agriculture and fishing | 18% | 4.38 | 1.6 | 5.98 |
| Wholesale and retail trade | 17.1% | 4.61 | 1.09 | 5.69 |
| Manufacturing | 14.6% | 4.2 | 0.67 | 4.87 |
| Construction | 11.5% | 3.8 | 0.03 | 3.83 |
| Transport and storage | 8.7% | 2.85 | 0.04 | 2.89 |
Labour-force participation, age 15+, Q1 2026
| Population group | Participation (%) |
|---|---|
| All | 47.6% |
| Men | 72.5% |
| Women | 21.5% |
| Urban | 46.4% |
| Rural | 48.6% |
Labour force, employment and unemployment, Q1 2026
| Measure | Urban | Rural | Men | Women | All |
|---|---|---|---|---|---|
| Labour force | 15.24 | 20.17 | 27.59 | 7.82 | 35.41 |
| Employed | 13.96 | 19.33 | 26.58 | 6.7 | 33.29 |
| Unemployed | 1.28 | 0.84 | 1.01 | 1.12 | 2.13 |
Employment status by gender, Q1 2026
| Status | Men | Women | All |
|---|---|---|---|
| Paid employees | 18.78 | 4.19 | 22.98 |
| Self-employed | 5.34 | 0.89 | 6.23 |
| Unpaid family workers | 0.87 | 1.54 | 2.4 |
| Employers hiring others | 1.59 | 0.09 | 1.68 |
Unemployment rates by gender and location
| Group | Q1 2026 | Q4 2025 |
|---|---|---|
| National | 6% | 6.2% |
| Men | 3.6% | 3.8% |
| Women | 14.3% | 14.3% |
| Urban | 8.4% | 9.7% |
| Rural | 4.2% | 3.4% |
Share of unemployed people by qualification, Q1 2026
| Qualification | Share (%) |
|---|---|
| University and above | 41.5% |
| Intermediate and above-intermediate | 38.1% |
| Below intermediate and lower | 20.4% |
Private-sector figures raise questions requiring closer examination. Women’s employment rose from approximately 2.2 million in 2022 to 7.2 million in 2023, an increase exceeding 220%, while men’s employment fell from 10.2 million to 6.8 million. Total private employment increased by only around 1.6 million. Such an abrupt change in the gender distribution may reflect reclassification or changes in methodology, particularly because it does not align with other indicators of women’s labour-market participation.
Private-sector employment by gender
| Year | Men (million) | Women (million) |
|---|---|---|
| 2020 | 10.72 | 2.05 |
| 2021 | 8.15 | 4.48 |
| 2022 | 10.22 | 2.24 |
| 2023 | 6.81 | 7.24 |
Do growing economic activities protect workers’ rights?
Recruitment platform Employsome estimates average private-sector monthly pay at approximately EGP 18,500 in 2026, compared with around EGP 8,500 for government and informal-sector workers. Oil and gas, finance and technology lead its salary estimates, while retail, hospitality and education are at the lower end. These platform estimates are not directly comparable with official wage statistics for different years and populations.
Explore the original salary estimates and tax-band graphic in English
Estimated monthly salary ranges by industry, 2026
| Industry | Lower (EGP) | Upper (EGP) |
|---|---|---|
| Oil, gas and energy | 38,000 | 65,000 |
| Banking and financial services | 32,000 | 55,000 |
| Technology and software | 28,000 | 55,000 |
| Pharmaceuticals and healthcare | 24,000 | 42,000 |
| Telecommunications | 22,000 | 40,000 |
| Construction and property | 18,000 | 35,000 |
| Manufacturing | 14,000 | 28,000 |
| Logistics and transport | 12,000 | 22,000 |
| Private education | 10,000 | 18,000 |
| Retail and hospitality | 8500 | 15,000 |
Estimated monthly salary ranges for selected occupations
| Occupation | Lower (EGP) | Upper (EGP) |
|---|---|---|
| Software engineer | 28,000 | 48,000 |
| Production manager | 32,000 | 55,000 |
| Financial analyst | 22,000 | 38,000 |
| Finance director | 45,000 | 80,000 |
| Customer service (Arabic) | 9500 | 18,000 |
| Customer service (foreign language) | 16,000 | 28,000 |
| Human resources | 24,000 | 42,000 |
| Marketing manager | 28,000 | 48,000 |
Annual income-tax bands displayed in the original graphic
| Annual band (EGP) | Rate (%) |
|---|---|
| Up to 40,000 | 0 |
| 40,001–55,000 | 10 |
| 55,001–70,000 | 15 |
| 70,001–200,000 | 20 |
| 200,001–400,000 | 22.5 |
| 400,001–1,200,000 | 25 |
| Above 1,200,000 | 27.5 |
The latest CAPMAS wage figures cited in the report give average monthly earnings of EGP 6,336 across public and private establishments in 2024: EGP 14,660 in the public sector and EGP 5,796 in the private sector. Men averaged EGP 6,523 and women EGP 5,529. Public-sector men earned EGP 14,540 on average, against EGP 5,998 in private establishments; women earned EGP 15,206 and EGP 4,928, respectively. Financial intermediation and insurance led at EGP 19,897, followed by electricity and gas (EGP 14,994), communications (EGP 12,897), mining and quarrying (EGP 12,091) and construction (EGP 10,773). Average monthly working hours were 187 in public establishments and 221 in private ones.
Khaled El-Shafei, head of the Capital Centre for Economic Research, tells Zawia3 that major projects have relied heavily on subcontractors and day labourers: temporary, irregular workers. A lower overall unemployment rate, he says, conceals extensive precarious employment without job security, insurance or continuity.
Government, foreign and domestic investment has injected money and provided millions of job opportunities in recent years, he adds. But he describes these as “painkillers”: absorbing some graduates and workers while population growth increases annual demand for jobs.
He argues that investments absorbed returning migrants and new graduates, preventing catastrophic unemployment, but did not turn the boom into permanent jobs with health and social insurance. Preparing the ground for future productive investment coincided with falling real wages that could not keep up with inflation. Precarious work and working poverty grew as employment depended on rent-generating and service sectors at the expense of exports and manufacturing.
The 2025 figures cited show unemployment of 2.7% among people aged 40–49, against 17.4% among those aged 20–24. The rate was 1.9% among people unable to read or write, compared with 12.6% among university graduates and 11.3% among those in the graphic’s secondary-education category, alongside growing reliance on informal work.
Explore the historical employment and unemployment data, 2020–2025
Employed people by age: historical series shown in the Arabic graphic
| Age | 2020 | 2021 | 2022 | 2023 | 2024 | 2025 |
|---|---|---|---|---|---|---|
| 15–19 | 1.21 | 0.91 | 0.73 | 0.74 | 1.11 | 1.25 |
| 20–24 | 2.58 | 1.99 | 1.71 | 1.85 | 2.17 | 1.88 |
| 25–29 | 3.4 | 2.51 | 2.47 | 2.47 | 2.51 | 2.09 |
| 30–39 | 5.53 | 6.02 | 6.05 | 5.98 | 6.09 | 4.13 |
| 40–49 | 4.41 | 4.8 | 5.12 | 5.15 | 5.18 | 4.95 |
| 50–59 | 3.29 | 3.63 | 3.58 | 3.63 | 3.46 | 3.6 |
| 60–64 | 0.55 | 0.52 | 0.55 | 0.62 | 0.7 | 0.88 |
| 65+ | 0.36 | 0.4 | 0.25 | 0.29 | 0.34 | 0.39 |
Employment by activity: historical series shown in the Arabic graphic
| Activity | 2020 | 2021 | 2022 | 2023 | 2024 | 2025 |
|---|---|---|---|---|---|---|
| Agriculture and fishing | 4.39 | 3.9 | 3.87 | 3.81 | 3.99 | 3.85 |
| Wholesale/retail and vehicle repair | 3.34 | 3.16 | 2.92 | 3.19 | 3.44 | 3.2 |
| Construction | 2.83 | 2.86 | 2.89 | 2.91 | 2.77 | 2.04 |
| Manufacturing | 2.73 | 2.55 | 2.58 | 2.65 | 2.87 | 2.76 |
| Transport and storage | 1.79 | 1.88 | 1.9 | 2 | 1.95 | 1.57 |
| Education | 1.59 | 1.7 | 1.64 | 1.51 | 1.63 | 1.38 |
| Health and social work | 0.77 | 0.76 | 0.7 | 0.83 | 0.73 | 0.75 |
| Accommodation and food services | 0.64 | 0.63 | 0.62 | 0.7 | 0.75 | 0.68 |
| Electricity, gas and steam | 0.15 | 0.18 | 0.2 | 0.23 | 0.2 | 0.22 |
| Information and communication | 0.17 | 0.17 | 0.18 | 0.19 | 0.16 | 0.16 |
Unemployment by age
| Age | 2020 | 2021 | 2022 | 2023 | 2024 | 2025 |
|---|---|---|---|---|---|---|
| 15–19 | 10.1% | 15.5% | 14.4% | 13.3% | 12.2% | 8.1% |
| 20–24 | 18.8% | 20.9% | 21.5% | 21.2% | 18.5% | 17.4% |
| 25–29 | 11.1% | 13% | 14.3% | 12.6% | 11% | 11.6% |
| 30–39 | 4.8% | 5.9% | 5.5% | 5.4% | 5% | 5.8% |
| 40–49 | 3.2% | 2.8% | 2.9% | 3.1% | 2.8% | 2.7% |
| 50–59 | 1.9% | 1.7% | 1.9% | 1.7% | 1.3% | 1.8% |
| 60–64 | 2.7% | 2.3% | 2.5% | 2.5% | 1.6% | 2.4% |
Unemployment by educational attainment
| Attainment | 2020 | 2021 | 2022 | 2023 | 2024 | 2025 |
|---|---|---|---|---|---|---|
| Unable to read/write | 2.2% | 2.5% | 1.9% | 1.7% | 1.9% | 1.9% |
| Reads and writes | 3% | 3.3% | 2.9% | 3.1% | 2.6% | 2.6% |
| Below intermediate | 4.7% | 5.5% | 4.4% | 4.9% | 3.9% | 4% |
| Intermediate | 6.1% | 6.6% | 5.6% | 6.1% | 5.4% | 4.6% |
| Above intermediate | 8.6% | 8.9% | 10.5% | 9.1% | 8.8% | 10.5% |
| Secondary | 7.8% | 8.5% | 10.8% | 7.3% | 8.6% | 11.3% |
| University | 15.9% | 15.7% | 14.6% | 13.7% | 13.2% | 12.6% |
Wael Gamal, head of the Egyptian Initiative for Personal Rights’ economic and social rights unit, tells Zawia3 that unemployment alone cannot measure labour-market development. Participation in the labour force is equally important. He puts it at around 45% of working-age people, a level he considers low, reflecting people outside the market after discouragement or giving up looking for work.
CAPMAS’s most recent figure cited in the report puts economic participation at 47.6% of the population aged 15 and above. This differs from Gamal’s approximate 45% estimate and should be understood with its specified age coverage.
Construction, contracting, wholesale and retail trade and delivery create jobs, Gamal says, but many are temporary or precarious and lack stability, insurance and basic rights. They cannot ensure decent living standards. Workers in foreign-investment projects may be more productive than counterparts in domestic sectors without that productivity being reflected in pay.
He describes recent growth as insufficiently job-generating: output has grown faster than new employment, while domestic and foreign investment is concentrated in activities with relatively low labour intensity, including finance, technology and renewable energy. A falling unemployment rate therefore does not, in his view, demonstrate a fundamental improvement in job creation.
Is informal work better than no work?
Economist Mostafa Badra considers falling unemployment a direct indicator of increased employment. The labour market extends beyond formal jobs to the informal or parallel economy, including temporary and irregular workers. Such work provides income to large groups, even when it lacks stability or remains outside formal systems.
He acknowledges that wages have not kept pace with recent inflation despite expanded investment, but argues that investment has increased employment and reduced unemployment. The gap between prices and incomes remains an obstacle. Nevertheless, he considers broader employment—even below the minimum wage—better than joblessness.
Gamal disagrees. International economic evidence, he argues, does not support a blanket claim that raising minimum wages increases unemployment. Several empirical studies have found that improved pay need not reduce employment, contrary to common assertions.
He cites figures showing that each $1 billion of foreign direct investment in Egypt created around 1,100 jobs, compared with approximately 1,600 in the Middle East and 2,100 in OECD countries. The issue extends beyond the number of jobs: many are temporary or unstable, poorly paid and offer limited social protection, while a substantial group remains suspended between formal and informal work.
The OECD’s review cited in the report says foreign investment created approximately 275,000 direct jobs in Egypt during 2013–23, compared with 165,000 in 2003–12. It gives the same comparisons of 1,100, 1,600 and 2,100 jobs per $1 billion.
Repeated inflation shocks and currency depreciation, El-Shafei says, have made wages in many new investments—especially at their early stages—unfair and insufficient for basic living costs. Workers feel that they are “working to remain poor.”
Labour Minister Hassan Raddad has said the political leadership is committed to applying international labour standards through legislation, social dialogue and trade-union freedoms. He described the labour law as a practical expression of that commitment, with provisions protecting workers amid changing employment patterns.
El-Shafei argues that productive industrial and agricultural investment, including technology and modern agriculture, has not gained sufficient momentum to drive the economy. Productive projects, he says, are what create sustainable, high-quality jobs that improve skills and pay.
Temporary workers and day labourers count towards lower unemployment under local and international survey definitions, he notes. Someone who performs paid work during the reference week can be classified as employed even if the work is brief; employment status does not by itself establish adequate hours, wages or protection.
Does the state guarantee a decent wage?
Egypt’s Labour Law No. 14 of 2025 regulates employment relationships, including a normal maximum working week of 48 hours, paid leave, additional compensation for overtime and work on rest days or holidays, annual increases and minimum-wage obligations. It also provides for a fund to protect and support irregular workers and regulates children’s employment. The Arabic text compresses different overtime and holiday rules into a 135%–300% range; those figures should not be understood as a single uniform overtime entitlement or as an unrestricted prohibition on all work by minors.
Critics quoted in the report consider the 2025 law a continuation of policies favouring employers and investors rather than a significant advance for workers, amid declining living standards, rising poverty and a shrinking share of output going to labour.
A Centre for Trade Union and Workers Services report recorded approximately 32,500 cases of non-implementation of the minimum wage; 16,200 involving absent occupational-safety requirements or health coverage; 13,200 involving withheld or reduced profit payments; 11,900 involving cancelled or delayed allowances; 10,700 dismissal threats; 8,600 compulsory-leave cases; and 7,000 threats to involve National Security. It recorded another 7,000 cases of workers being prevented from leaving factories, alongside 32 restrictions on liberty or detentions. Separately, 8,317 occupational injuries were recorded in 2023—7,264 among men and 1,053 among women—with 52% in the private sector. These counts describe the cited reports’ recorded cases, rather than a survey of all workplaces.
The ITUC Global Rights Index lists Egypt among the ten worst countries for workers in 2026, in category 5, “no guarantee of rights.” The index assesses collective labour rights and reported violations. The Arabic text’s statement that the Middle East and North Africa had been the worst region for eleven consecutive years should not be treated as the period count of the 2026 edition.
Gamal identifies some positive references in the law to groups previously overlooked, including platform workers. But weak implementation and oversight, he argues, limit their ability to benefit even from its modest protections.
El-Shafei says small and medium-sized companies arising from new investments sometimes avoid formalisation to evade tax and social-insurance costs. Construction and fast services have historically relied on chains of recruited day labour that are difficult to formalise. Workers themselves may prefer their full pay in cash to deductions for insurance or taxes.
He rates job quality as low to moderate. A structural reason is the prominence of contracting as an employment engine in property and infrastructure: labour-intensive activities that absorb unemployment but end when a project finishes and do not necessarily create continuing added value once it opens.
What would a fair minimum wage look like?
Zawia3’s review of social-media recruitment advertisements in emerging economic activities found many offering no guarantee of the monthly minimum wage, social or medical insurance, specified working hours or a legal employment contract. For day labourers, such protections can seem like a luxury.
Construction advertisements posted by intermediaries working with contractors were particularly striking. They often provided no insurance guarantees or commitment to legally specified hours, while daily pay hovered around EGP 350—approximately $6.50 at the exchange rate used in the report—and sometimes less.
Zawia3 analysed 66 Facebook posts recruiting construction day labourers on June 10, 2026. Housing appeared in 34.85% of advertisements, meals without specified contents in 19.70%, and transport in 7.58%. General labourers accounted for 45.45% of advertised roles, followed by formwork carpenters (22.73%) and rebar workers (18.18%). The sample is limited to these posts and is not a representative survey of Egypt’s labour market.
Daily wages ranged from EGP 250 to EGP 900 according to occupation and skill. General labourers had the lowest pay, while carpenters and rebar workers earned more. Higher-paying advertisements often involved specialist trades or sites outside main residential areas, including the New Administrative Capital and El-Alamein, reflecting attempts to attract skilled workers and, in some cases, compensate for travel or accommodation costs.
Daily wages in sampled construction advertisements
| Occupation | Lowest (EGP) | Highest (EGP) | Average (EGP) |
|---|---|---|---|
| General labourer | 250 | 450 | 350 |
| Formwork carpenter | 500 | 800 | 650 |
| Rebar worker | 500 | 900 | 700 |
| Plasterer | 450 | 800 | 620 |
Wage disclosure in sampled advertisements
| Disclosure | Share (%) |
|---|---|
| Wage stated | 27 |
| Wage not stated | 73 |
Benefits mentioned in sampled advertisements
| Benefit | Share (%) |
|---|---|
| Housing | 34.9% |
| Meals | 19.7% |
| Transport | 7.6% |
| No benefits mentioned | 50% |
Occupations sought in sampled advertisements
| Occupation | Share (%) |
|---|---|
| General labourer | 45.5% |
| Formwork carpenter | 22.7% |
| Rebar worker | 18.2% |
| Plastering and finishing | 9.1% |
| Other | 4.6% |
A fair wage requires balancing the poverty line, inflation and a typical household’s essential consumption basket, El-Shafei says. He refers to the rise in the minimum wage to around EGP 7,000 amid 2024–26 inflation, arguing that it barely covers food and drink for a small family, before housing, education or healthcare. Moving from subsistence towards an adequate urban household income, he argues, requires at least EGP 10,000 a month, indexed to annual inflation. His EGP 7,000 reference concerns the earlier wage level, rather than the later EGP 8,000 public-sector increase discussed below.
Badra also regards EGP 10,000 a month as a fair level under current living costs and inflation. Immediate implementation would be difficult, he says, because institutions and private businesses may be unable to afford it. Better purchasing power requires lower prices and stronger social-protection programmes as well as higher wages.
Gamal says EIPR estimated the income needed to reach the national poverty line at EGP 8,964 per household per month after cumulative inflation. He considers the rise in the minimum wage to EGP 8,000 still insufficient for living costs. His priority is comprehensive enforcement before differentiated wage policies by sector or region. A household poverty threshold and an individual worker’s wage are different measures.
In its April 2026 statement, EIPR estimated the national poverty threshold at approximately EGP 8,964 per household per month, updating for price increases from January 2020 to February 2026. It put the extreme-poverty threshold at approximately EGP 6,500 on the same cumulative-inflation basis.
For Gamal, the enforcement crisis concerns coverage and oversight as much as the nominal wage level. Many sectors still rely on temporary workers, including education, where large numbers of teachers are paid per lesson.
Economic policy may bring unemployment down to 6%, but the challenge is the nature of employment as well as its volume. Statistics can improve through temporary, low-paid jobs without ensuring better lives. Between having work and having dignity, the question for the state remains: is it enough that Egyptians work, or should they have decent jobs?
Rabab’s intermediary company deducts approximately 35% of her and her colleagues’ pay as a contractual charge or administrative costs. Her salary on paper is EGP 9,000; the amount she actually receives is EGP 5,900.
El-Hels and his colleagues receive only daily pay and transport in a small pickup to the new compound. There are no other benefits. They pool money from their wages to pay for food.
Harb asks a question far removed from economic indicators, but shared by many Egyptians concerned only with earning a living and unable to afford the luxury of protest: “Will I find work tomorrow or not?”